What will happen to your company if you were to retrieve specific financial records done a year ago? There will be a lot of panicking and going through a big pile of paperwork. You might spend time sifting through the records to find the exact one. It will be annoying if you realize that you were not organized with your record-keeping because some documents might be missing. The situation will be very stressful if you were not using a chart of accounts. A chart of accounts helps you allocate each transaction from your business to some category (Rylee, 2017). You can see precisely where your business generates and spend money. No matter the type of business, you should have a chart of accounts.
So, what is A Chart of Accounts?
It is an accounting tool that acts as a whole list of each account used by an organization. How do we define an account? It is a record for each type of asset, liability, revenue, expense, and equity. Rylee considers the tool sorts to classify, and join each of the accounts where appropriate, thereby simplifying things for logging and tracking. It is meant to replace an old-school system by setting up distinctly labeled drawers for every vital accounting record. Instead of using a lot of papers, it gives your business a high-level assessment of each area of the business that makes or uses money by listing every account involved in daily operations. For example, you will need to incorporate details like sales, the rent for office space or store, cost of shipping among other costs. If a business uses an accounting system, such as QuickBooks or ScaleFactor, it already has a chart of accounts and does not need to establish one outside of the chosen online system. Rather, it will need to improve the categories for different transactions.
Source: (Rylee, 2017)
How does a chart of accounts work?
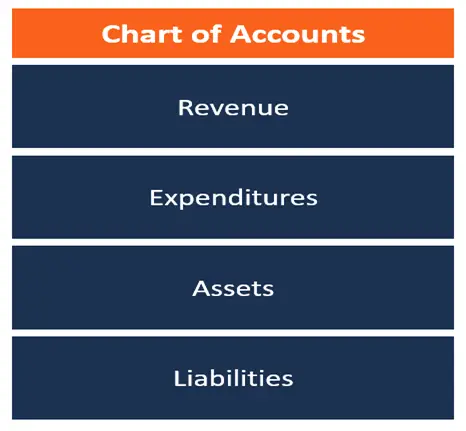
A chart of accounts shows accounts in the order they look like on your financial statements. Therefore, assets, liabilities, as well as shareholders’ equity (balance sheet) are displayed first, then followed by expenses and revenue (income statement). In a chart of accounts, the above broad groups could have a substantial number of subgroups. For instance, assets can include Accounts receivable (Prepaid expenses, Cash, Inventory, Petty cash, Fixed assets, Marketable securities), Accumulated depreciation, and Allowance for doubtful accounts. Liabilities will also be broken down into these subgroups, which include Accounts payable (Taxes payable, wages payable, Notes payable) and Accrued Liabilities. Shareholders’ equity can consist of Preferred stock, Common stock, and Retained earnings (Syafnidawati, Suryana & Aryani, 2017).
Further, you can structure the chart of accounts so that expenses and revenue are grouped according to the product line, business function, or company division. Every account on the chart of accounts has an identification code, name, and description. This makes it simple to locate accounts, because a chart of accounts can become complex, particularly for large businesses. For a multinational corporation with numerous divisions, the chart of accounts can even include a lot of individual financial accounts.
The Formula
The basic chart of accounts is created using the double-entry accounting system established in the 13th century by Luca Pacioli. It is the tried-and-true process of tracking business transactions across the world. The process is founded on a simple equation:
Assets = Equity+ Liabilities
This forms the basic accounting equation that underlies the financial statement referred to as the balance sheet, which is the first part of the chart of accounts.
The second part of the chart of accounts comprises the income statement (profit-and-loss statement). The simple equation is:
Profit or Loss = Revenues – Expenses
Assets
What does a business own? First, we have current assets, which are those assets, which can be liquidated easily. They include things such as cash in the bank, accounts receivable, money market accounts, and inventory. Second, we have fixed assets, which are hard to liquidate, and include office equipment, heavy machinery, vehicles, and land. Examples of groups under assets would be prepaid insurance, deposited funds, and company vehicles.
Liabilities
What does a company owe? An example of a liability is an outstanding loan. Any account represented by ‘payable’ or ‘loan’ is a liability. Liabilities are grouped as short, medium, and long-term. Examples of accounts in the class of liabilities include the mortgage on an office building, vehicle loans, and payroll dues.
Revenue
Where does the company’s money come from? Revenue sources include sales of goods and services, royalties, professional fees, commissions, among other transactions. Income that is not generated from the daily business transactions is considered as other income. Examples of charts of accounts that would be classified under revenue include service income (such as training), labor income (such as construction), and reimbursement income (such as mileage).
Expenses
What regular payments does a business make? Some examples of expenses include utility expenses (water, gas, internet) and professional services, such as legal services, medical costs, and insurance. A one-off expense is typically considered another expense. Examples of accounts categorized under expenses include supplies expense, wages expense, prepaid expenses, depreciation expenses, and bank charges.
What is the Basic Chart of Accounts?
Every business is unique and needs changes to the basic chart of accounts, but the overall framework remains the same.
Balance sheet
Assets fill the main two parts in a standard chart of accounts. The first part is for long-lasting and depreciable assets, such as vehicles, equipment, and fixtures. Such accounts are usually numbered in the 000s. The second section is usually characterized by accounts numbered in the 100s and are cash and cash equivalent assets, such as accounts receivables.
Next in the chart are liabilities and including lines of credit, accounts payable, loans, mortgages, as well as payroll tax withholdings. (Note: Part of what the firm takes out of a worker’s paycheck is not an expense but a liability). Such accounts are numbered in the 200s.
The 300s accounts are kept for the equity section of the balance sheet. Depending on the nature of the business, accounts in this part could include retained earnings, capital stock, owners’ equity, accumulated adjustments, and the present fiscal year’s profit or loss (Syafnidawati, Suryana & Aryani, 2017).
Income statement
This starts with accounts labeled in the 400s and comprises service income, sales, or other forms of income generated from business operations. The 500s are reserved for accounts falling into the category of cost of goods sold. This may include accounts for the supplies, materials, and labor required to produce or manufacture the product sold by a business. It is imperative to note that this part may not be required if the firm is selling a service that does not need materials.
The other section is used for general operating expenses and ranges from workers’ compensation insurance to advertising to everything in between. This part is numbered in the 600s, and is the most flexible part of any chart of accounts and will vary widely depending on the business. The final two parts are optional and may not be used in every business. The 700s are whereby a business list non-business associated income. This part is for things such as interest, rebates, and dividends. The 800s are for non-business connected expenses, such as charitable donations (Syafnidawati, Suryana & Aryani, 2017).
What steps should you consider when reviewing and drafting your chart of accounts?
First, you should use experienced specialists who have faced different situations when doing accounting classifications. Second, you should ensure that your firm’s accounting manual is being composed simultaneously with the preparation or revision of your chart of accounts. This will give room for a reflection on the nature of every ledger account at the time of preparing or revising the chart of accounts. Also, you should list all or most of the operations of your company (purchase of assets, purchase of goods, contracting services, among others) and assess their accounting in the created chart of accounts. You will understand that there will be doubts that will be used as learning to close the accounting knowledge of each one (Banghoj et al., 2021).
Why is a Chart of Accounts important?
According to Banghoj and colleagues, an organization’s chart of accounts characterizes the set accounts that will support every journal entry. However, contrary to what is usually applied in businesses, the most essential factor in the chart of accounts is the thorough and rather systematic picture of the nature of every ledger account. The complete picture of the accounts, often known as accounting policies, company accounting bible, or company accounting handbook should give all kinds of journal entries that must be allocated in every account and the journal entries not to be recorded. Also, a good handbook contains examples of situations and operations to be posted or not posted on each account.
In such a context and looking at a large number of business sectors and their characteristics, it is incredible to have a chart of accounts that fits everybody. Therefore, a good accounting company or department should acclimatize its reality to the requirements of every company and avoid making its accounting plan stiff. The needs of every company will understand the ideal chart of accounts for the analytical and managerial monitoring of its working accounting and reporting of financial statements. The more complete a chart of account can offer better prominence of the business’s equity and financial state. It should consider the significance of the totalizing and analytical accounts, thereby avoiding unnecessary details and redundancies.
Another applicable matter when creating the chart of accounts is its direct association with the Tax-Accounting Bookkeeping and Accounting Bookkeeping. Their effects should be analyzed, particularly in the income statement, because they are used when calculating Social Contribution on Net Income and Corporate Income Tax.
Adjusting Your Chart of Accounts
You can include as many accounts as you wish throughout the year, but you should not delete any of the old accounts in the chart until the end of the year, because it might mess up your books and cause other problems. If there is no need to make changes, it might be okay to include it under a new account for that specific item or group rather than record it in the expense account area where it could have originally been put. This can help keep things attuned appropriately without interfering with the numbers in other groups throughout the year. For instance, let’s say that you began the year with one account for advertisement but were interested in improving your spending to the channels that generated the most returns. Therefore, you should split them into individual expense groupings like Advertising – Facebook, Advertising – Amazon, or Advertising – Apple. Then there should be a charge for a new advertisement channel you are trying to explore like Pinterest, rather than posting to your original advertisement expense account you might prefer adding a new account known as Advertising-Other.
Summary
It is important to have a chart of accounts because it gives a map of your organization and its financial parts. When the chart is well-designed, it separates every organization’s most critical accounts and makes it easy to examine where to record every transaction. It gives room for improved financial decisions, offers a precise snapshot of the business’s financial health, and makes it easy to follow the standards of financial reporting. However, Banghoj and colleagues established several Chart of Accounts best practices to apply. First, you should avoid making any accounts that will be used for a particular period such as the “Christmas party” account. Instead, you should use “Company events.” Also, you should create a chart of the account by getting a birds-eye view of your business, but that does not imply that every single detail from every transaction needs to be included. All names of accounts should have a title so that everybody in the accounting department knows what each account represents. This helps to easily and accurately classify business transactions. Finally, names of accounts should never be tied to a specific customer or vendor.
References
Banghoj, J. M., Christensen, L., Larsen, J. G., Rohde, C., Skinnerup, T., & Skærbæk, P. (2021). 8 Common Chart of Accounts. Public Sector Reform and Performance Management in Developed Economies: Outcomes-Based Approaches in Practice.
Rylee, C. D. (2017). So, you need a new chart of accounts. Planning for Higher Education, 45(3), 60.
Syafnidawati, S., Suryana, E., & Aryani, D. (2017). Utilization Chart of Account for Effectiveness Company Cash Mapping on Web-Based Accounting Online System 2.0. Aptisi Transactions on Agriculture, 1(1), 38-43.